Barton and Johnston Equation
For Copolymer Glass Transition Temperature
A number of semi-empirical equations have been proposed to predict the glass transition temperature (Tg) of a copolymer from its overall composition and the Tg's of the corresponding homopolymers of the monomers. Two of the earliest models that include the monomer arrangement or sequence distribution in the prediction were proposed by Barton and Johnston.1,2 Although different in detail, both models predict very similar glass transition temperatures for copolymers which are in excellent agreement with published data for numerous copolymer systems.3,4
Barton’s and Johnston’s model have been called dyad models, because both predict the glass transition temperature from the mass or mole fractions of the monomer dyads found in the copolymer chain. If, for example, a copolymer chain is composed of two types of monomers A and B, four different dyad sequences can be observed: AA, BB, AB, and BA (see figure below).
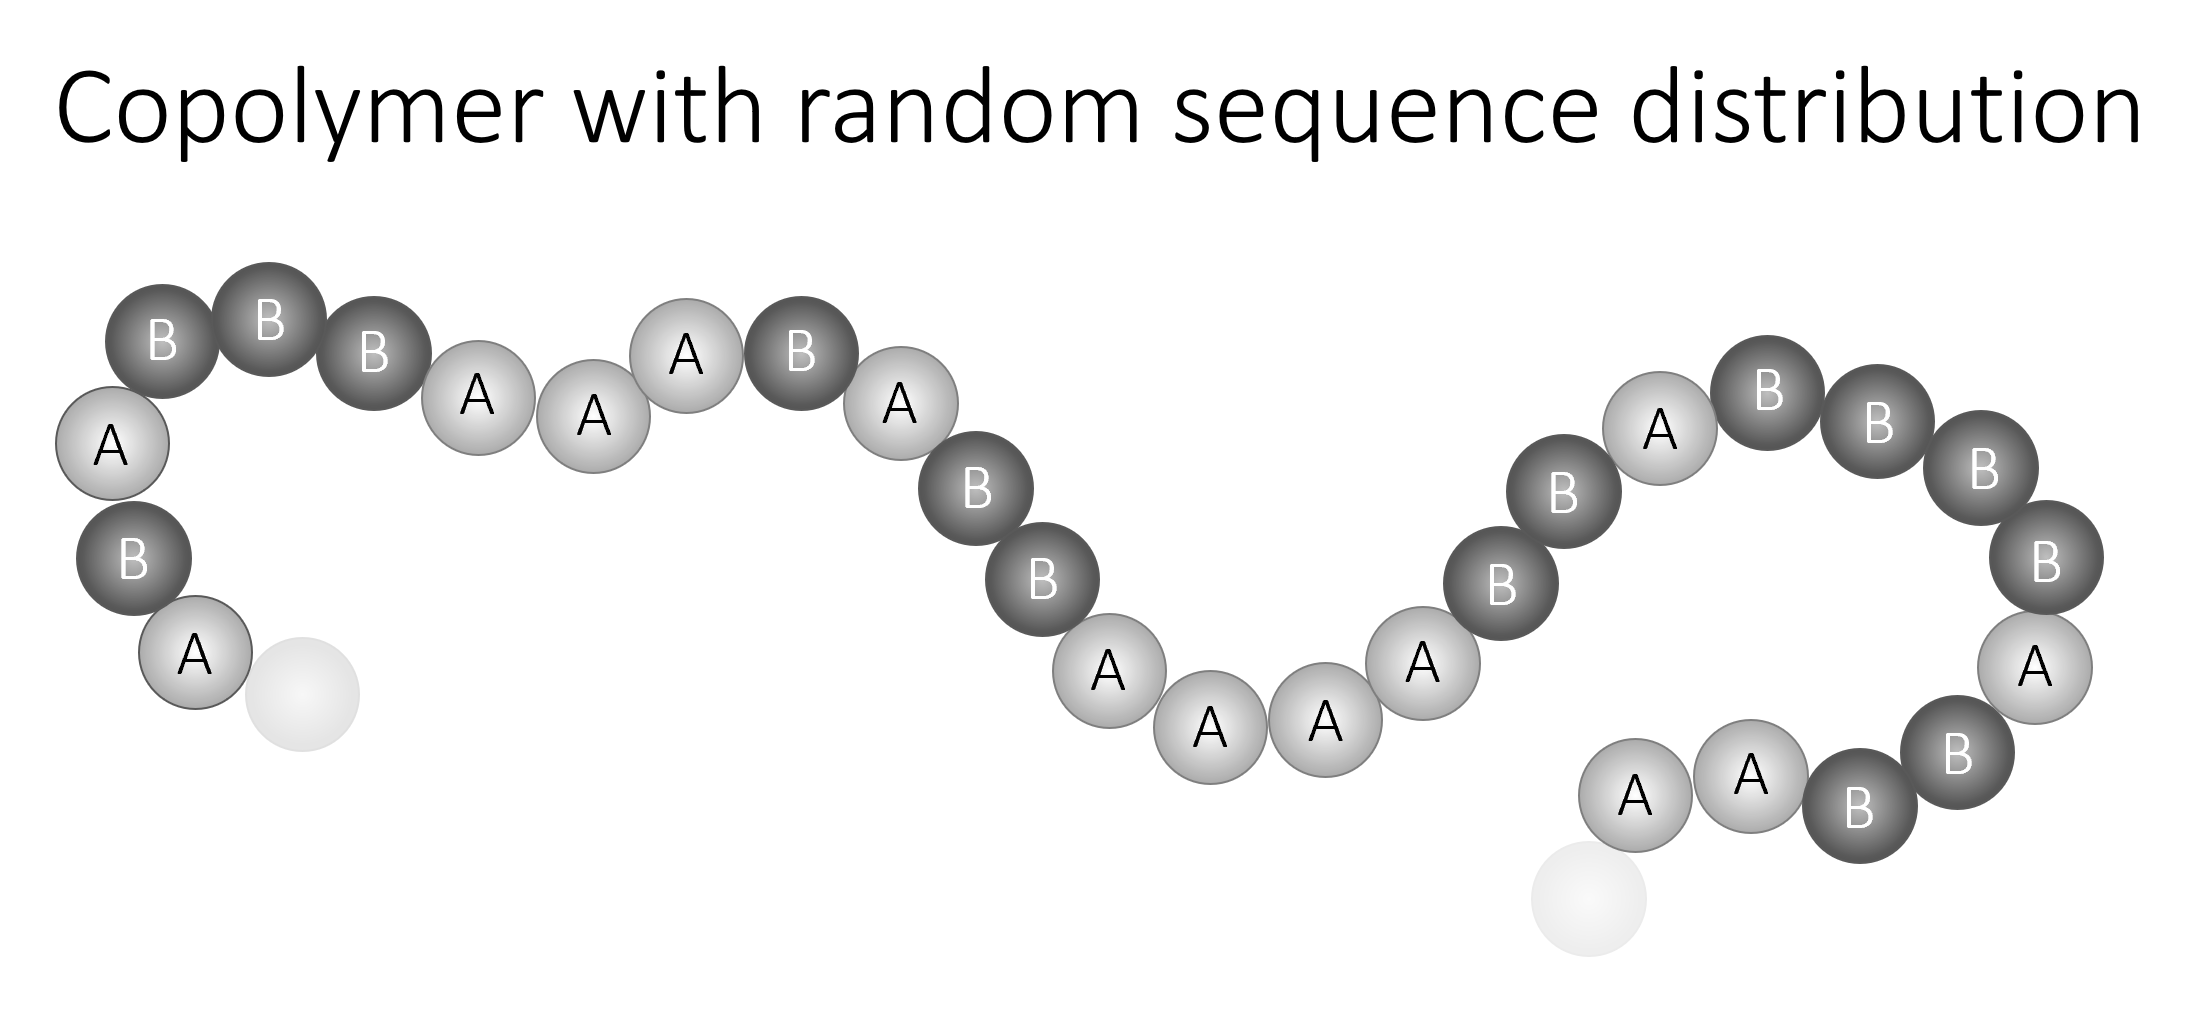
Since AB and BA linkages are chemically equivalent, the number of different linkages in the copolymer chain is only three. These three linkages have generally different stiffness, i.e. different bond length and bond angle vibrations which in turn determine the glass transition temperature. For this reason, Barton postulated that the Tg of a copolymer depends on the mole fractions xij of the three different dyads in the AB-copolymer:1
Tg = xAA · Tg,A + xBB · Tg,B + (xAB + xBA) · Tg,AB
where Tg,AB is the glass transition temperature of an AB alternating copolymer and xij is the mole fraction of an ij dyad sequence. The latter is equal to the product of the mole fraction of i units xi and the probability Pij that a given i unit has a j unit on its right, xij = xi Pij.3,4
Tg = xA PAA Tg,A + xB PBB Tg,B + (xA PAB + xB PBA) · Tg,AB
According to Harwood and Ritchey5, the sequence distribution of a copolymer with monomer mole fractions xA and xB can be described by a single parameter, the so called run number R, which is the average number of monomer sequences (or runs) found in a copolymer per 100 monomer units. From R the average number of AA, BB and AB dyads can be easily calculated. For example, the mole fraction of A-B linkages is simply xAB = R / 200, since there are as many A runs as B runs in the copolymer. The number of A-A runs, on the other hand, is equal to the number of A units present in the copolymers minus the number of A-B linkages. Thus, xAA = xA - R / 200 and xBB = xB - R / 200. With these relations, Barton's equation can be rewritten as3,4
Tg = xA · Tg,A + xB · Tg,B + R / 100 · [Tg,AB - Tg,avg]
with
Tg,avg = (Tg,A + Tg,B) / 2
Johnston chose as a starting point the Fox equation which he extended to2
1 / Tg = ωA PAA / Tg,A + ωB PBB / Tg,B + (ωA PAB + ωB PBA) / Tg,AB
where ωi is the weight fraction of a repeat unit and Pij is the probability that a given i unit has a j unit on its right (or left). As has been shown by Suszuki and Miyamoto, the equation can can be rewritten in the form4,6
1 / Tg = ωA
/ Tg,A +
ωB / Tg,B + R / 200Mavg ·
[(MA + MB)
/ Tg,AB
- MA /Tg,A
- MB /Tg,B]
with
Mavg = xA MA + xB MB
where Mi is the formula weight of a repeat unit i. Note, unlike many other models, Johnston's and Barton's models have no adjustable fitting parameters.
To calculate glass transition temperatures for a given copolymer composition, we need to know the monomer sequence or run number R of the copolymer. This parameter can be either determined experimentally, for example from spectroscopic measurements, or it can be estimated indirectly from the following equation4
R = 400 xA xB / {1 + [1 + 4 xA xB (rArB - 1)]½}
where rA and rB are the monomer reactivity ratios in copolymerization.
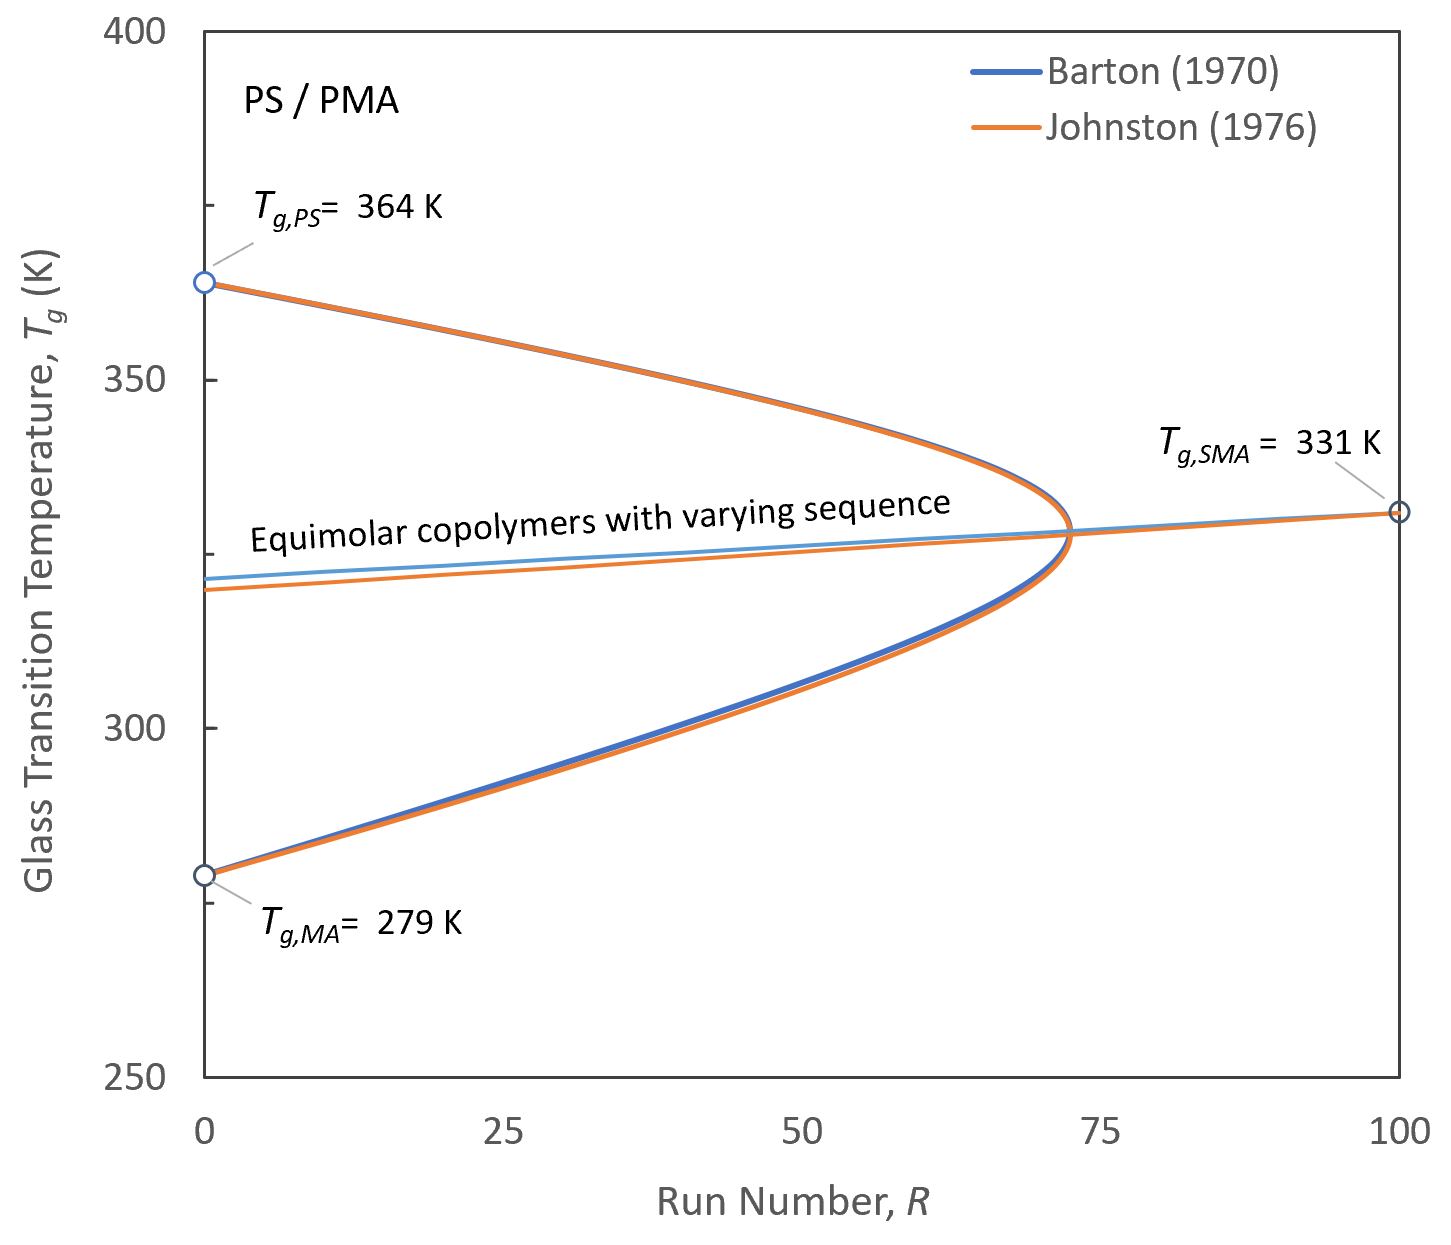
As an example, the figure below shows the Johnston and Barton equation for statistical styrene / methyl acrylate copolymers. The curves have been calculated with the Barton's data: 337.7 K for Tg,S-MA and 0.75 / 0.18 for rS / rMA.1 It can be seen that both equations predict very similar glass transition temperatures.
Glass Transition Temperature of PS-PMA Copolymers
References & Notes
- J. M. Barton, J. Polym. Sci., Part C, 30, 573-597 (1970)
- N. W. Johnston, J. Macromol. Sci. Rev. Macromol. Chem., C14, 215 (1976)
- H. Suszuki and Y. Muraoka, Bull. Inst. Chem. Res., Kyoto Univ., 67, 2, 47-53 (1989)
- H. Suzuki and T. Miyamoto, Bull. Inst. Chem. Res., Kyoto Univ., 66, 3, 297-311 (1988)
- H. J. Harwood and W. M. Ritchey, J. Polym. Sci., B2, 601-607 (1964)
- Note, Suzuki's expression4 reads 1 / Tg = ωA Tg,A + ... but it should read 1 / Tg = ωA / Tg,A + ...