Gibbs-Thomson Equation
Effect of Crystal Size on Melting Point
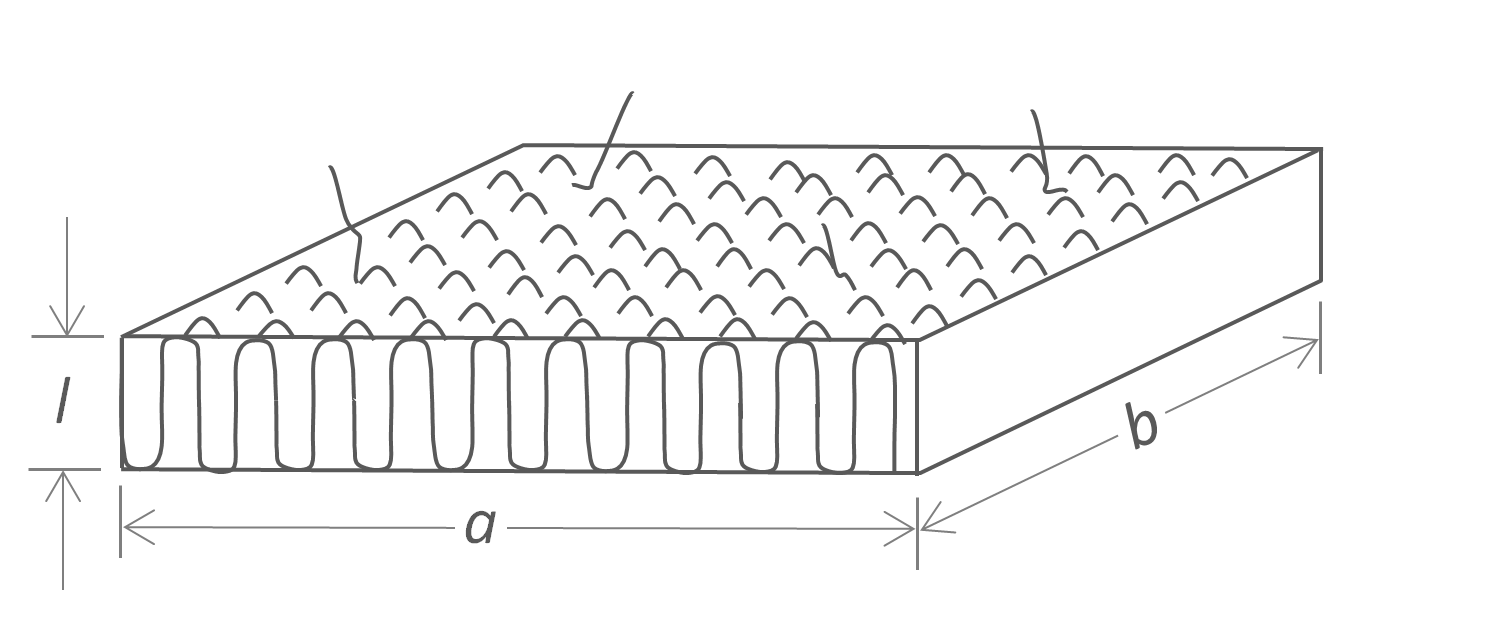
Linear polymers are known to crystallize from their melt into regular lamellar structures when cooled below their melting point. The dependence of the melting point on crystal size can be described with the Gibbs-Thomson equation. A schematic picture of a lamellar crystal is shown below. It is assumed that the thickness l of the lamellae is much smaller than the lateral dimension. The Gibbs free energy of such a lamellae consists of three terms; the first two terms describe the energy necessary to create new surfaces and the third is the bulk free energy of fusion:
ΔGlam = 2abσe + 2l (a+b) σ - abl Δgf
where σ and σe are the surface free energy of the lateral and end surfaces of the lamella (see Figure below). Both σ and σe are considered constants that are difficult to measure or to calculate, that is, usually only estimates exist. In many cases, l « a,b, so that the contribution of σ to the crystal energy can be neglected in good approximation,
ΔGlam ≈ 2abσe - abl Δgf
At the melting point of the crystal, ΔGlam = 0, thus
Δgf ≈ 2σe / l
Lamellar Crystal with Chain folds
The free energy of fusion involves both an enthalpic and entropic change
Δgf = Δhf - T Δsf
Assuming Δsf and Δhf show only a small temperature dependence, both quantities have values very similar to those of an infinite large crystal which melts at Tm,∞:
Δhf(Tm,∞) ≈ Δhf(Tm)
Δsf(Tm,∞) ≈ Δsf(Tm)
Thus
Δgf(Tm) ≈ Δhf(Tm,∞) (1 - Tm/Tm,∞)
Which can be rewritten to give the Gibbs-Thomson relation:1,2
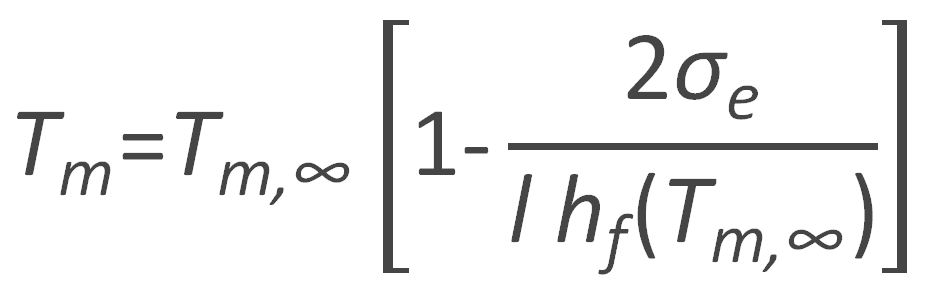
or
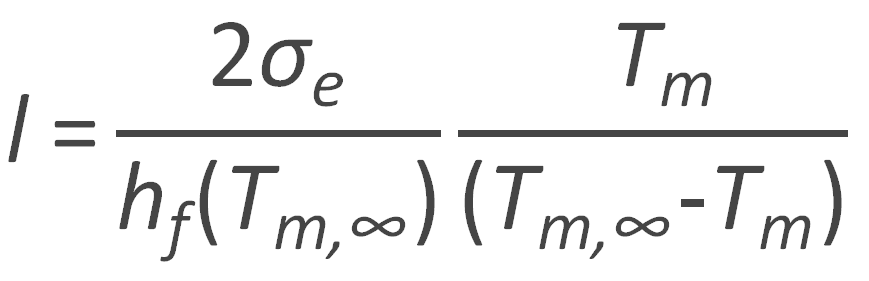
This equation allows for the prediction of the melting point Tm as a function of the lamellar thickness l. If, on the other hand, both the melting temperature of an infinite large and that of the actual crystals are known, the free energy σe can be calculated, for example by plotting the observed temperatures versus the reciprocal lamellar thickness 1/l (see Fig. below).
Gibbs-Thomson Plot
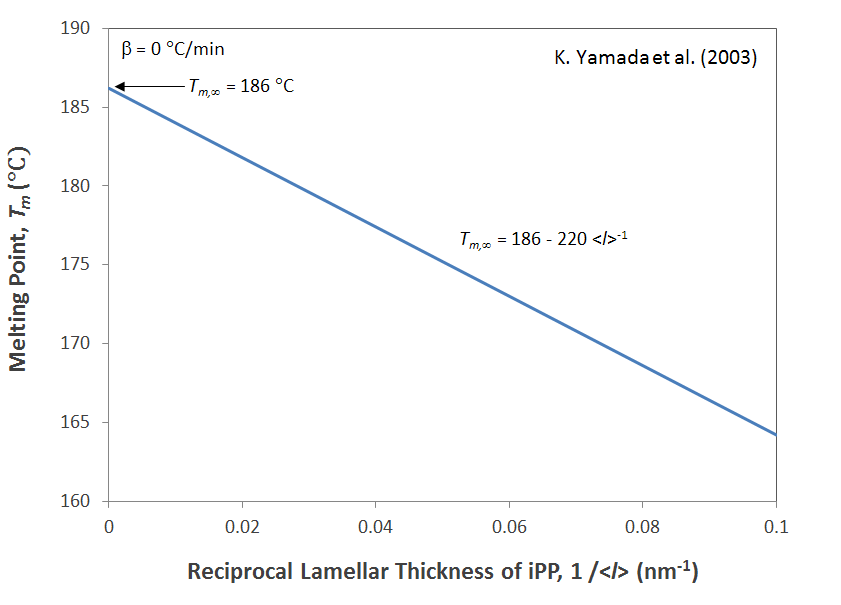
The Gibbs-Thomson equation has been applied to many linear polymers such as isotactic polypropylene and polyethylene. It was shown to give reliable predictions of the melting point as a function of lamellar thickness.4
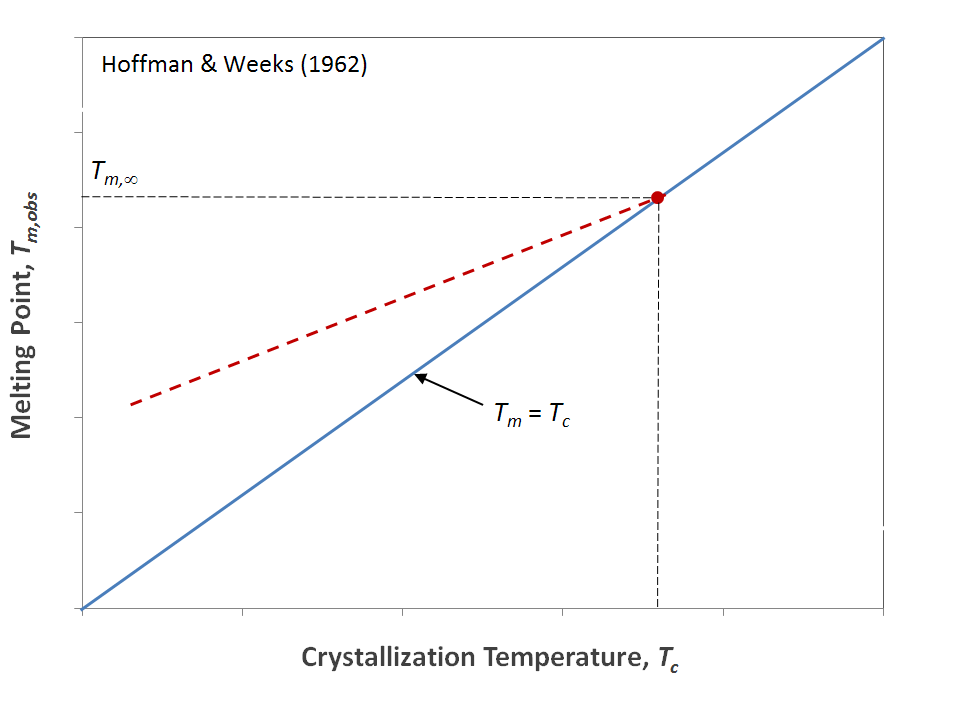
Another important relation has been derived by Hoffman and Weeks (1962).2 Their expression relates the observed melting point Tm,obs of a polymer to its crystallization temperature Tc and equilibrium melting point Tm,∞. To obtain these temperatures, a polymer specimen is crystallized isothermally at Tc after being cooled from its melt which is then subsequently heated at a specified rate until all traces of crystallinity have disappeard which defines Tm,obs. The experiment is then repeated for different Tc values. Hoffman, Lauritzen, and Weeks2,3 found that the curves of Tm,obs versus Tc can be describes with following simple relation:
Tm,obs ≈ Tm,∞ (1 - 1/γ) + Tc /γ
The equilibrium melting point is the intersection of these lines with the line Tm,obs = Tc.2 and the parameter γ is the thickening coefficient as determined by the Hoffman-Weeks plot.
Hoffman-Weeks Plot
The Hoffman-Weeks method is widely used to estimate melting points of polymers. However, Yamada et al. found that this method is not always reliable.4
References
J.J. Weeks, J. of Res., Vol. 67A, No. 5, pp. 441 - 451 (1963)
J. D. Hoffman and J.J. Weeks, J. of Res., Vol. 66A, No. 1, pp. 13 - 28 (1961)
-
J. D. Hoffman and J.I. Lauritzen, J. of Res., Vol. 65A, No. 4, pp. 297 - 336 (1961)
K. Yamada, M. Hikosaka, A. Toda, S. Yamazaki, and K. Tagashira, Macromolecules,
36, 4790-4801 (2003)